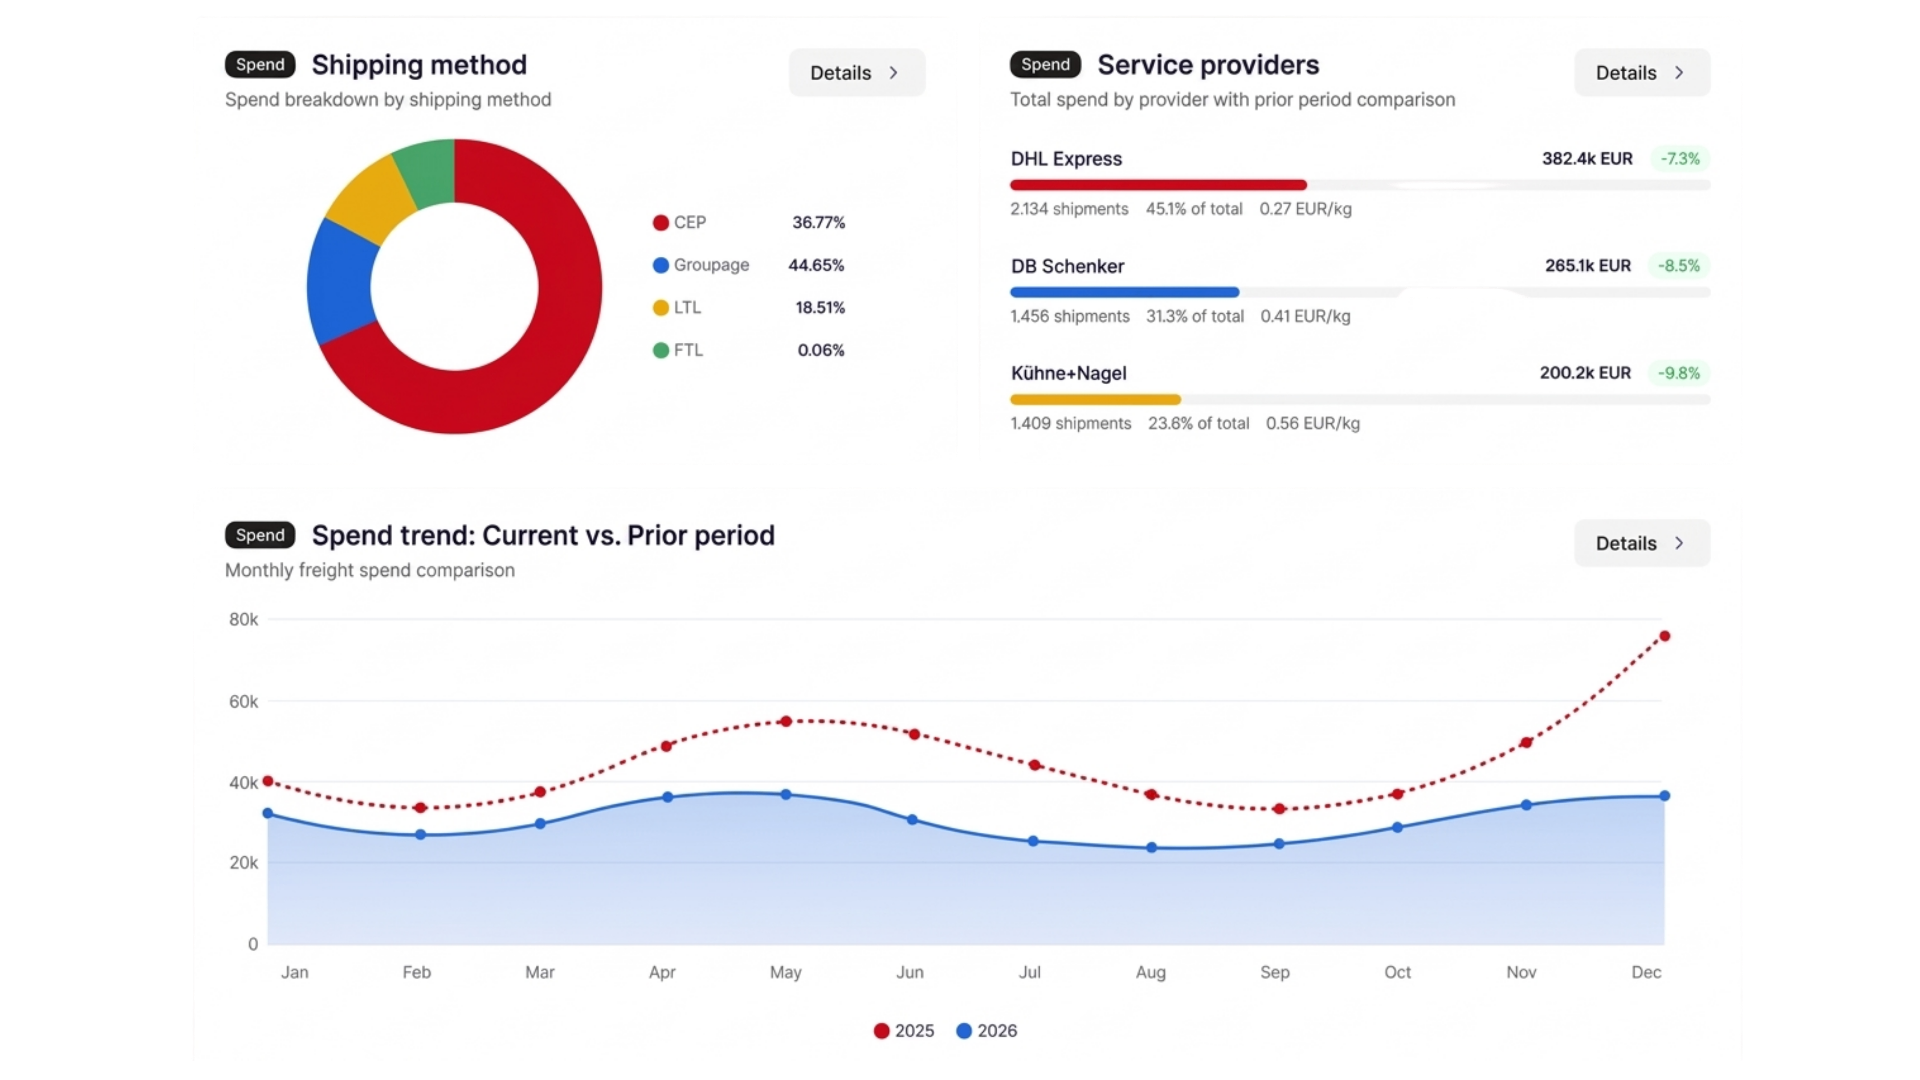
Many companies know exactly how high their total freight costs are. That is important – but this figure alone is not enough to manage logistics costs.
The decisive questions are not only “How much did we spend?” but also:
- Which shipments are becoming more expensive?
- Which lanes are driving costs?
- How is each carrier developing?
- How high is the share of surcharges?
- Where does the invoice deviate from the contract?
That is exactly why HDS works in practice with metrics that go significantly deeper than a standard ERP report. Particularly relevant metrics include cost per shipment, surcharge ratio and the variance between contract and invoice at line-item level.
What are freight cost KPIs?
Freight cost KPIs are metrics that companies use to measure, compare and manage their transport costs. They are not only about absolute total costs – a good KPI structure should also show why costs are changing.
To do this, freight costs need to be broken down by meaningful dimensions, for example:
- shipment
- carrier
- lane
- mode of transport
- surcharge type
- period
This turns a pure cost report into a management tool.
Why the total alone says too little
A figure such as “Freight costs in July: EUR 680,000” is relevant for management. But it says little about where action is required.
Did costs increase because:
- more shipments were sent?
- average shipments became heavier?
- individual lanes became more expensive?
- surcharges increased?
- one carrier was used more frequently?
- invoices deviate from the contract?
Without additional KPIs, the cause remains unclear. That is exactly why shipment-level analysis matters. HDS evaluates freight costs at a granular level and also takes ancillary freight costs into account.
KPI 1: Cost per shipment
One of the most important metrics is cost per shipment. It shows how much an individual transport costs on average. It becomes particularly meaningful when broken down further by:
- carrier
- lane
- mode of transport
- period
HDS identifies this exact metric as a central component of good logistics management. In practice, however, it is often not directly available and first has to be generated from different data sources or with significant Excel effort.
Why cost per shipment is better than total costs alone
If total costs increase, that may simply be because more shipments were sent. Cost per shipment helps separate volume and price effects more clearly.
| Metric | Development | Interpretation |
|---|---|---|
| Total costs | +8% | initially looks negative |
| Number of shipments | +12% | volume effect explains the increase |
| Cost per shipment | decreasing | cost efficiency per transport improved |
KPI 2: Cost per lane
Freight costs should not be viewed only by carrier or month. The lane is also decisive because a service provider can be highly competitive on one route and significantly more expensive on another.
An analysis by lane shows:
- which lanes are particularly expensive
- where costs are changing disproportionately
- which carriers are strong or weak on specific lanes
This is also important because individual freight segments and routes can develop very differently from an economic perspective. HDS explicitly points out that general statements about the overall market are only of limited help to an individual company if its specific lanes are developing differently.
KPI 3: Cost by carrier
Another central metric is cost development by service provider. It is not enough simply to look at the absolute invoiced amount: a large carrier will naturally account for more cost if it handles more volume.
More useful questions include:
- How are costs per shipment developing?
- Which lanes does the carrier operate?
- How high are the surcharges?
- How often do variances occur?
- How does the cost structure change over time?
This turns a simple supplier overview into a more robust performance and cost analysis.
KPI 4: Surcharge ratio
A frequently underestimated KPI is the surcharge ratio. It shows what share of total freight costs comes not from base freight, but from surcharges and ancillary services. These can include, for example:
- fuel surcharges
- tolls
- additional services
- other tariff-dependent ancillary costs
HDS explicitly identifies the surcharge ratio as a relevant metric in freight cost reporting. The ratio matters because stable base rates can conceal rising ancillary costs. A company may therefore have the impression that its freight rates are stable even while the actual cost per shipment continues to increase.
KPI 5: Contract vs. invoice variance
For freight invoice auditing, one metric is particularly important: the variance between contractually agreed costs and the costs actually invoiced.
What matters is not only a blanket monthly difference. HDS emphasizes variance at line-item level. That is exactly where the basis is created for making specific recoveries or claims traceable.
The metric answers: “What should have been charged according to the contract – and what was actually charged?” It can reveal variances in areas such as:
- base tariff
- surcharges
- discounts
- weight classes
- ancillary services
KPI 6: Ancillary freight costs per shipment
The absolute total of all ancillary costs is only of limited value. A more useful question is: How high are ancillary freight costs per shipment?
This allows companies to identify:
- whether surcharges are structurally increasing
- which carriers generate particularly high ancillary costs
- which lanes stand out
- whether cost development is becoming detached from the base rate
HDS therefore considers ancillary freight costs not only in aggregate, but at the level of the individual shipment.
KPI 7: Cost development over time
A good freight cost KPI should not show only a current value. The development over time is decisive, for example:
- cost per shipment month by month
- surcharge ratio over time
- cost per lane
- variances per carrier
- development of individual cost categories
This makes it possible to identify changes early. But here too, a comparison with a company’s own historical data is not automatically a market comparison.
A company can, for example, reduce its costs compared with the previous year and still be above the current market price. Conversely, a cost increase can be economically understandable if the relevant segment has become more expensive.
KPI 8: Variances by financial impact
Not every variance is equally relevant. An error of EUR 2 on one shipment is different from a small systematic variance that repeats a thousand times.
A good report should therefore not only count variances, but assess them by financial impact. ShipCheck categorizes variances, among other things, by whether they occur systematically or individually and prioritizes them according to financial effect. This helps direct operational attention to the cases where meaningful amounts are actually involved.
Which KPIs does logistics management need?
Logistics management primarily needs metrics that make operational causes visible. These include in particular:
- cost per shipment
- cost per lane
- cost per carrier
- surcharge ratio
- contract vs. invoice variances
- recurring anomalies
- cost development over time
These metrics help answer concrete questions: Where are the additional costs arising? Which service provider is affected? Which lane is changing? Which cost item is causing the variance?
Which KPIs does controlling need?
Controlling usually needs more aggregated metrics, for example:
- total freight costs
- freight costs over time
- cost per shipment
- share of ancillary freight costs
- budget variances
- realized savings
It is important, however, that aggregated metrics can be traced back to the underlying shipment when necessary. Only then can the reason why a KPI changed be explained.
Which KPIs are particularly relevant for CFOs?
For CFOs, metrics that make the financial effect of logistics visible are particularly relevant, for example:
- total freight costs
- cost development
- freight cost per shipment
- surcharge share
- identified overpayments
- realized recoveries
- savings actually realized
The decisive point is this: a management KPI should not only show a number, but should also be able to explain where that number comes from when required.
Why data quality is more important than the dashboard
A beautiful dashboard does not solve a data problem. If the underlying information is incomplete or poorly structured, the KPIs remain unreliable as well.
HDS describes data quality in companies as highly variable and often worse than initially assumed. Information may be distributed across several systems, individual locations may have gaps, and ancillary freight costs are often recorded only as lump sums.
Good freight cost reporting therefore does not begin with visualization. It begins with clean, granular and comparable data.
What data is needed for good freight cost KPIs?
Typically relevant are:
- freight invoices
- shipment data
- carrier
- lane
- weight
- mode of transport
- tariff information
- surcharge line items
- period
HDS identifies freight invoices or shipment data, existing contracts and tariff structures, and the most detailed possible information per shipment as the basis for a robust cost analysis. The more granular the data, the more precisely KPIs can be formed and explained.
Why standard ERP reports are often not enough
ERP systems are indispensable for accounting and corporate management. But they often answer different questions from specialized freight cost controlling.
| Question | Standard ERP report | Freight cost KPI |
|---|---|---|
| What was paid? | Yes – total per carrier | Yes |
| For which shipments? | Usually not | Yes, at shipment level |
| On which lanes? | Rarely | Yes |
| With which surcharges? | Often only lump sums | Yes, by surcharge type |
| Under which contractual conditions? | No | Yes, expected-vs.-actual at line-item level |
This additional granularity is often missing from standard reporting.
From the KPI to the individual shipment
The strongest form of a freight cost dashboard is therefore not one that shows as many metrics as possible on a single page, but one that allows users to move between different levels:
Total costs → carrier → lane → shipment → cost item
This means management can work with a small number of KPIs. If a number stands out, logistics can drill down to the specific cause. ShipCheck consolidates transport data and enables corresponding analyses by shipment, route and carrier, among other dimensions.
Which freight cost KPIs are really necessary?
Not every company needs 40 metrics. For many organizations, a small set of well-defined KPIs is enough. A sensible foundation can include:
- total freight costs
- cost per shipment
- cost per lane
- cost per carrier
- surcharge ratio
- contract-vs.-invoice variance
- cost development over time
Additional metrics can be added depending on the company. The decisive factor is not the number of metrics, but whether each one answers a concrete management or controlling question.
How ShipCheck makes freight cost KPIs visible
ShipCheck was developed in part because HDS clients repeatedly asked for KPI reporting that could be used continuously. The KPI dashboard consolidates freight and transport data and enables analyses, for example, by:
- shipment
- carrier
- lane
- period
- cost type
The goal is not to produce as many charts as possible. The goal is to turn existing freight information into a data basis that makes cost developments understandable and manageable.
Conclusion: Good freight cost KPIs explain not only what happened – but why
Total freight costs remain an important metric. But they are not enough. For robust logistics management, companies also need to understand:
- how much a shipment costs
- which lanes are becoming expensive
- which carrier is driving costs
- how high the share of surcharges is
- and where invoices deviate from the contract
That is where good freight cost controlling begins. A good KPI does not just show a number – when necessary, it leads all the way to the cause behind that number.
Frequently asked questions
Which KPIs are particularly important for freight costs?
The most important metrics include total freight costs, cost per shipment, cost per lane, cost by carrier, surcharge ratio and variances between contractually agreed and actually invoiced costs.
What does cost per shipment mean?
The metric shows the average freight cost per transport. It can also be analyzed by carrier, lane or period.
What is the surcharge ratio?
The surcharge ratio shows what share of total freight costs consists of surcharges and ancillary services rather than base freight.
Why is cost per lane important?
Because prices and market conditions can differ significantly between individual lanes. An average across all transports can conceal these differences.
Which KPI shows errors in carrier invoices?
Particularly relevant is the variance between contractually agreed expected costs and the actual invoiced costs – ideally down to line-item level.
Is an ERP system sufficient for freight cost reporting?
An ERP system can provide important total-cost information. Detailed freight cost controlling, however, often requires additional shipment, tariff, lane and surcharge information.
Which freight cost KPIs are relevant for a CFO?
Particularly relevant are total freight costs, cost development, cost per shipment, surcharge share, identified overpayments and savings actually realized.
Why should freight cost KPIs be analyzed at shipment level?
Because aggregated metrics show the overall trend but not necessarily the cause. A shipment-level data basis enables drill-down from the KPI to the specific cost item.