KPI Dashboard
Digitized Transport Data — Full Transparency. Free.
Use ShipCheck's complete KPI dashboard, controlling analyses, and period comparisons — without limits and without cost.
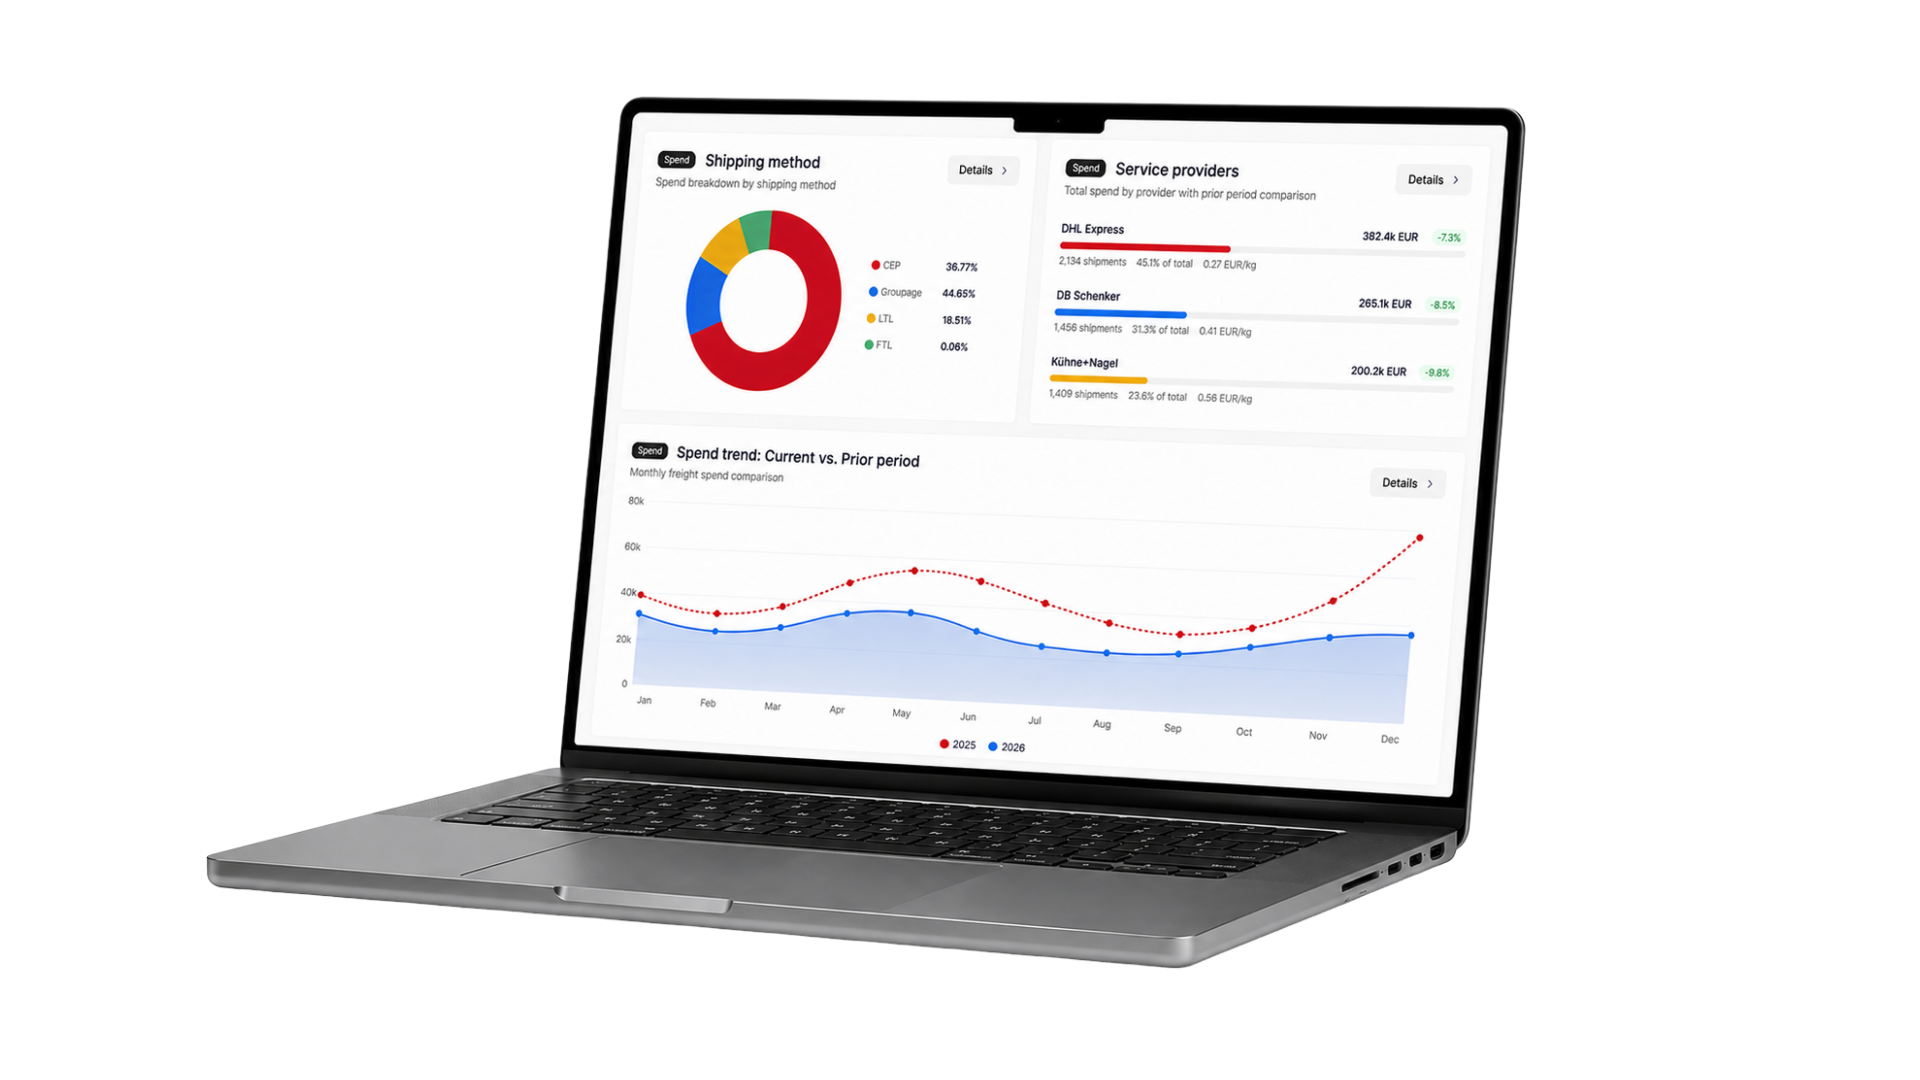 ★ FREE ★
A KPI Platform Built for Logistics Leaders
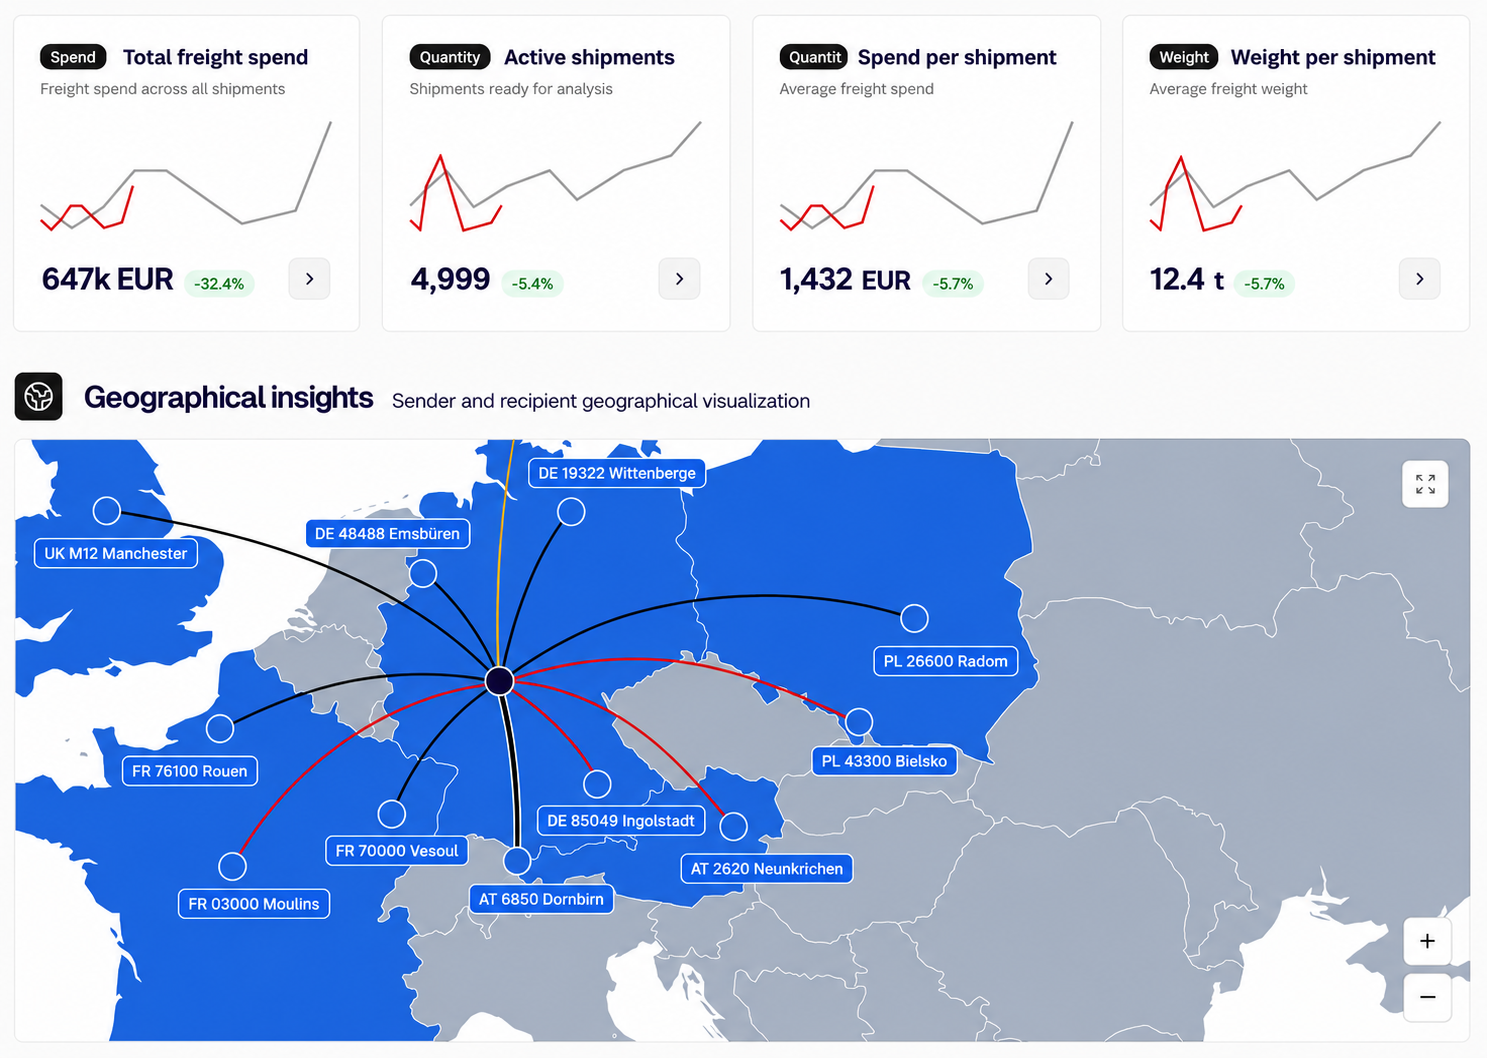
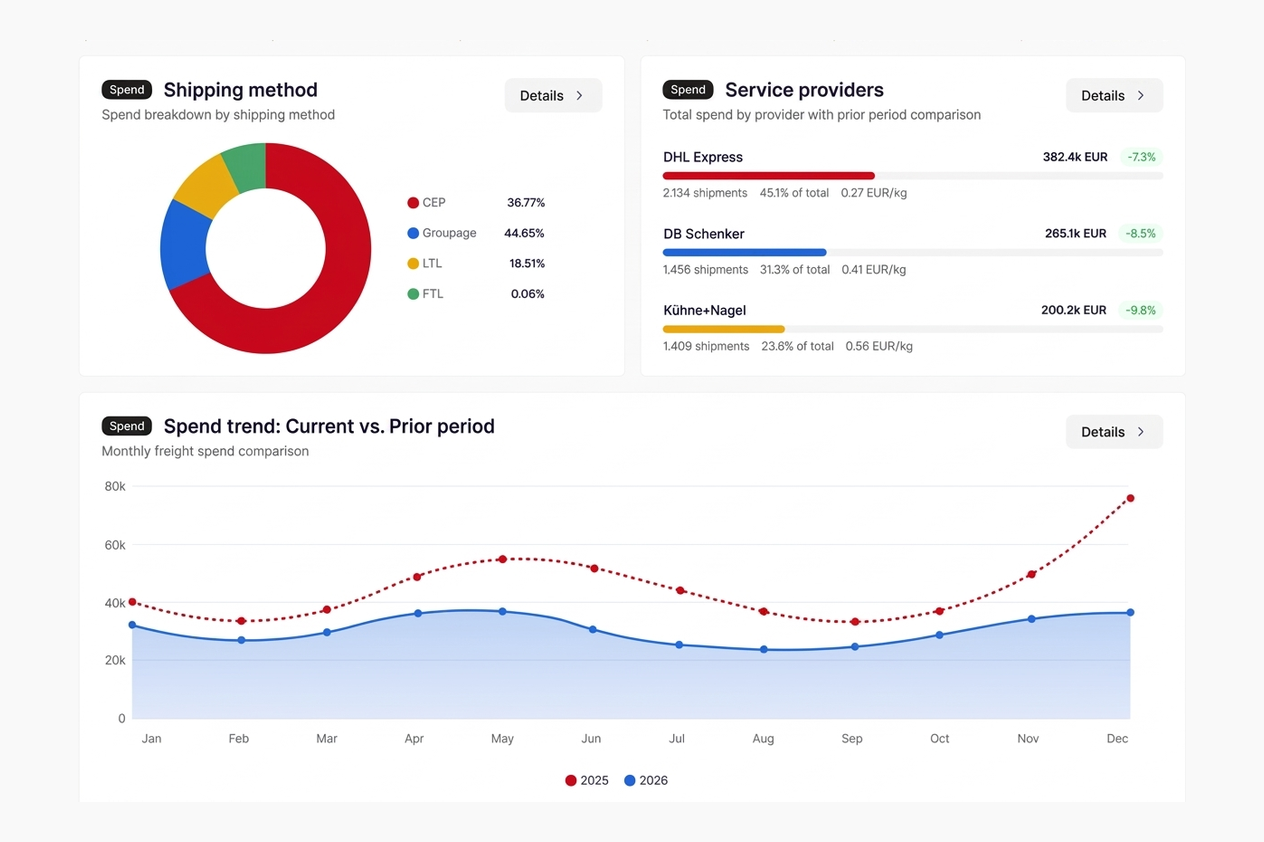
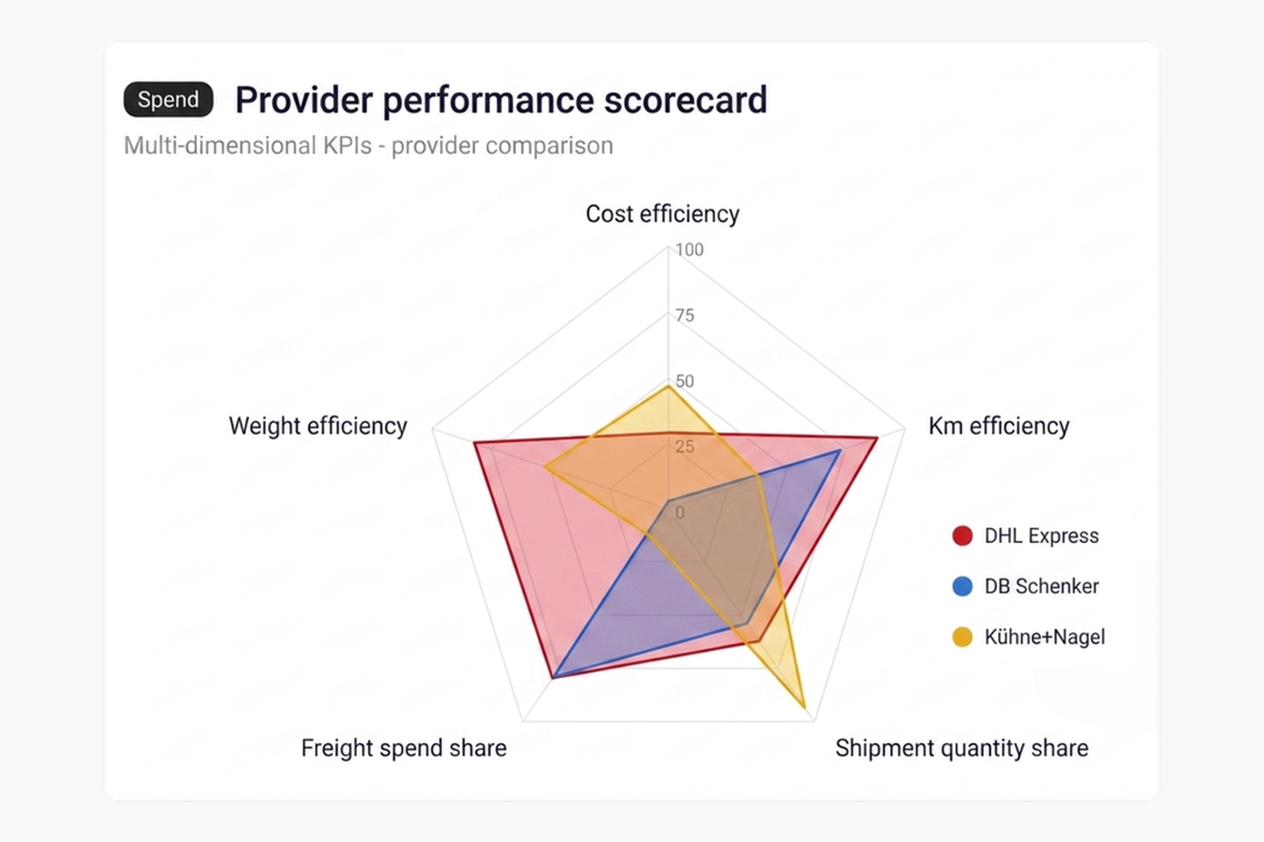
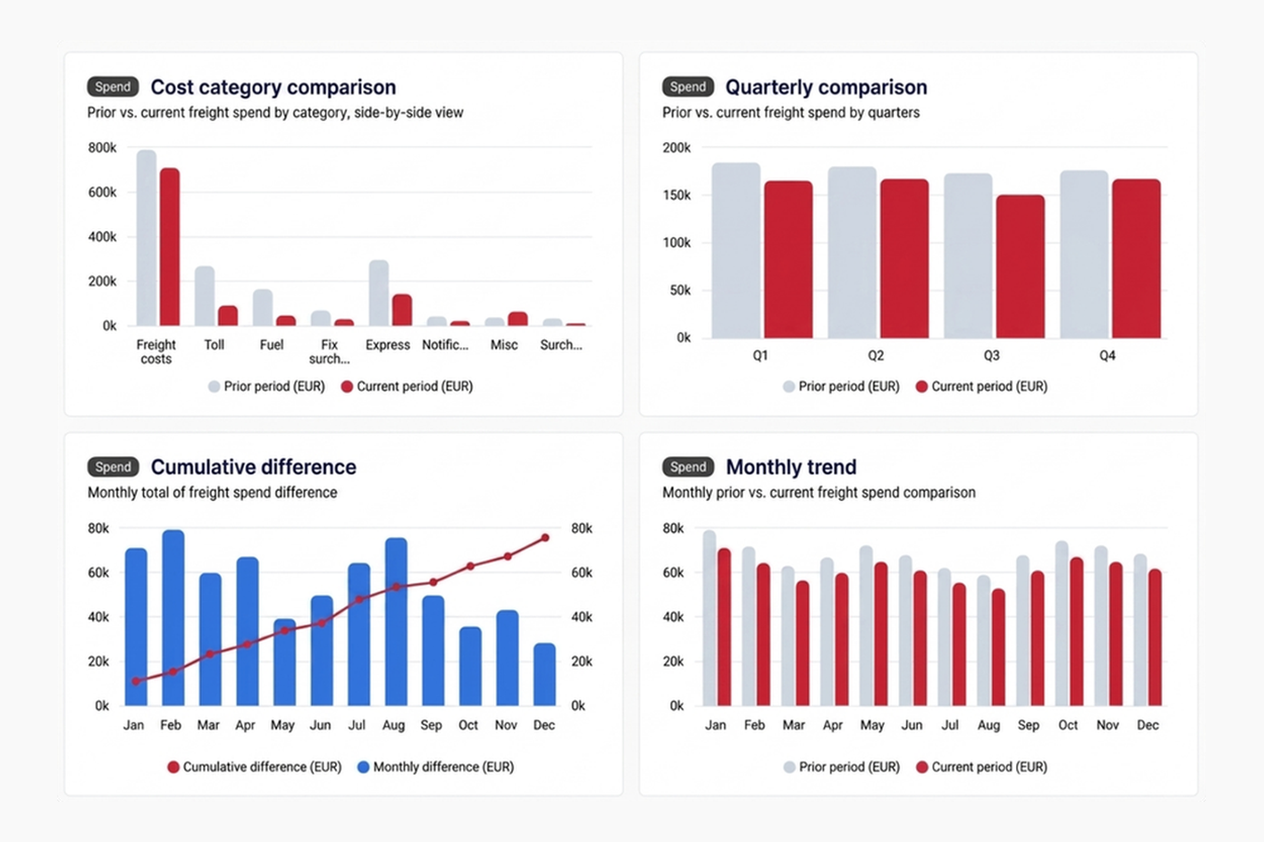
How the KPI Dashboard Works
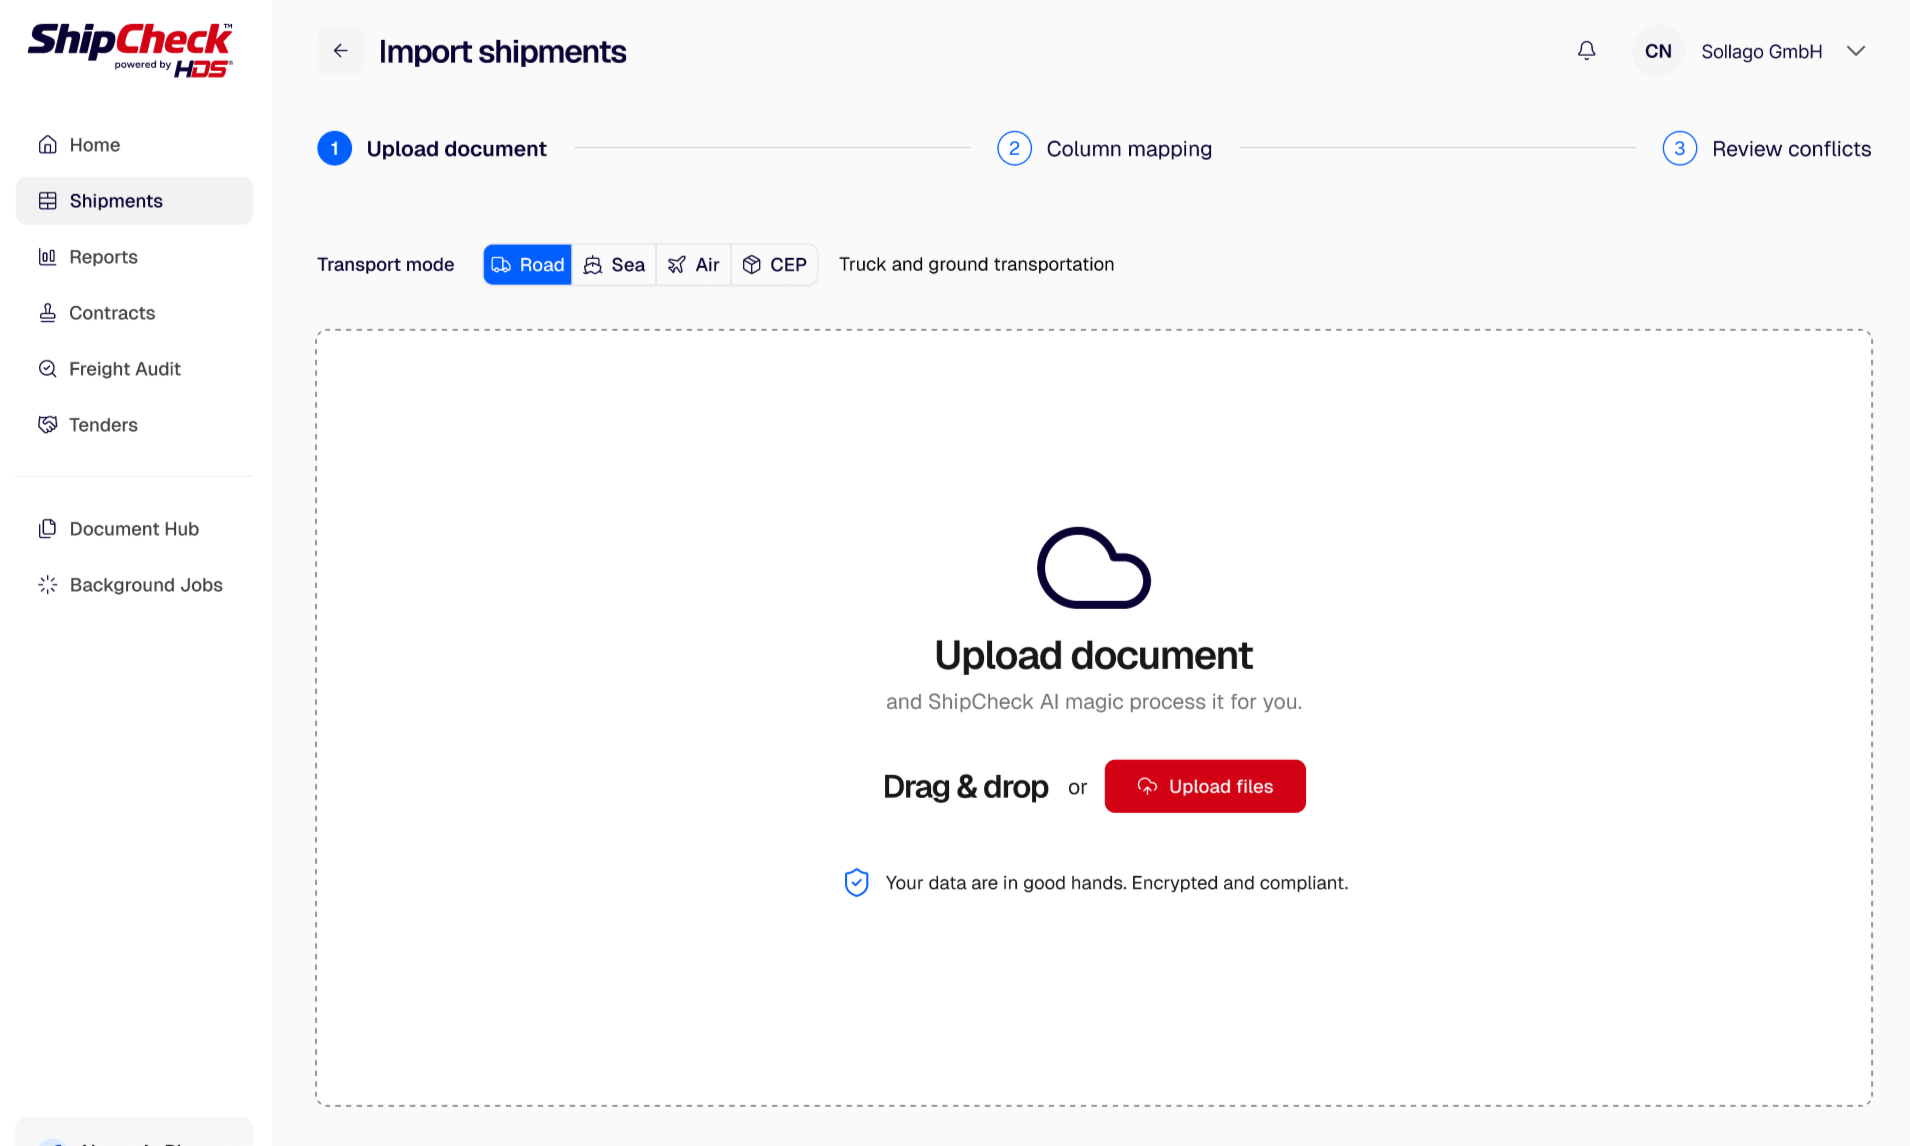
Digitization
Digitize all transport information
Digitize all your carrier invoices with ShipCheck and visualize TMS exports and ERP data. ShipCheck consolidates all information (order data, transport data, and invoice data) into a unified data foundation for consistent logistics controlling.
Dashboard Visualization
Automatic analysis
The system displays costs, trade lanes, recipient structures, and transport mode information per kg, per shipment, per route, and per carrier at shipment level. Deviations are flagged.
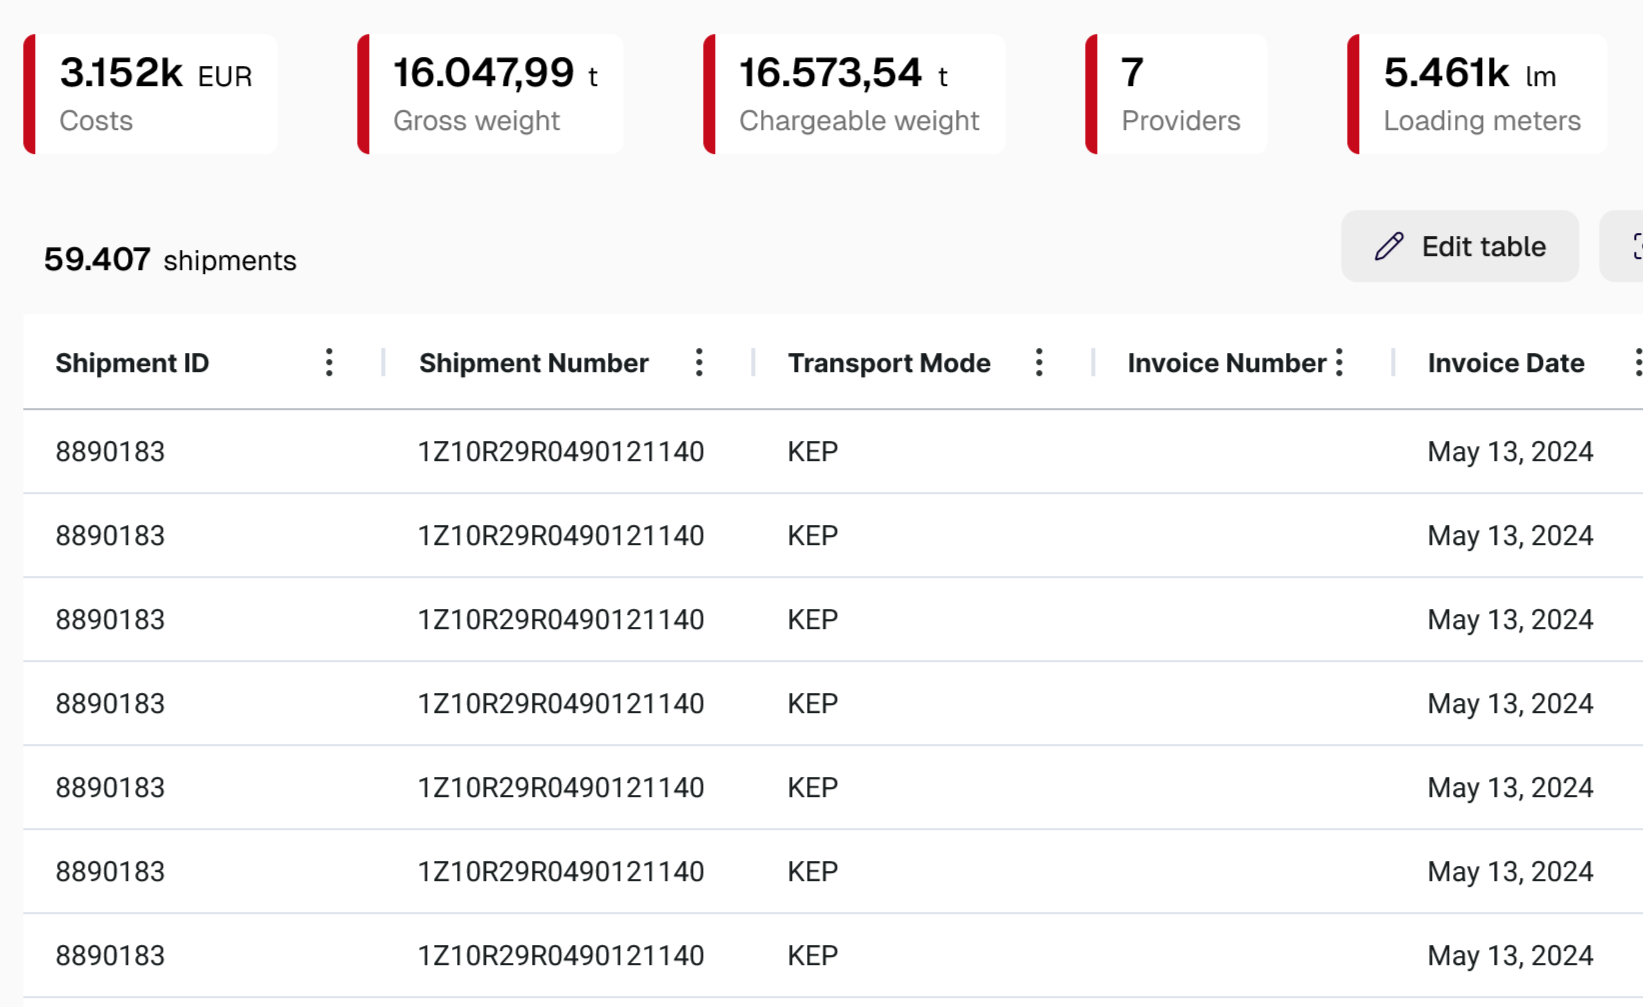
Optimization Through Insight
Data-driven decisions
Identify savings potential through comprehensive logistics controlling, compare structures, and make informed decisions based on reliable data.
These companies trust HDS and ShipCheck























Why Is This Free?
0
Conviction
Cost transparency is a right — not a premium feature.
0
Barriers
Most companies can't even access their own data. We're fixing that.
0
Forever
No freemium trick. No upsell. The KPI dashboard stays free.
0
Our Model
We earn from Audit & Tendering — not from the dashboard.
Not a marketing trick — a deliberate strategy. Transparency builds trust.
Everything You Need to Understand Your Logistics Costs
KPI Dashboard
- Real-time freight cost overview
- Cost by carrier
- Cost by transport mode
- Cost by relation / region
Controlling Analyses
- Cost driver analysis
- Carrier comparison
- Volume vs. cost ratio
- Trend identification
Period Comparisons
- Month-over-month
- Year-over-year
- Custom time ranges
Structural Reports
- Cost structure breakdown
- Modal split analysis
- Lane-level cost distribution
- Service-level comparison
See the KPI Dashboard in Action
In two minutes, learn how ShipCheck turns fragmented logistics data into clear KPIs.
No more spreadsheets. See how automated reporting works.
Built for Logistics, Finance & Controlling

Logistics Pro
Operational Focus
- Real-time overview of all shipments and costs
- Carrier performance at a glance
- Drill-down to individual shipment level
- Automatic detection of cost deviations

CFO / Controlling
Financial Focus
- Structured cost breakdown by category
- Period comparisons for monthly and annual reports
- Exportable reports for executive leadership
- Budget deviations and trend analyses
From the ShipCheck blog
Practical insights on freight costs, tariffs and logistics controlling.
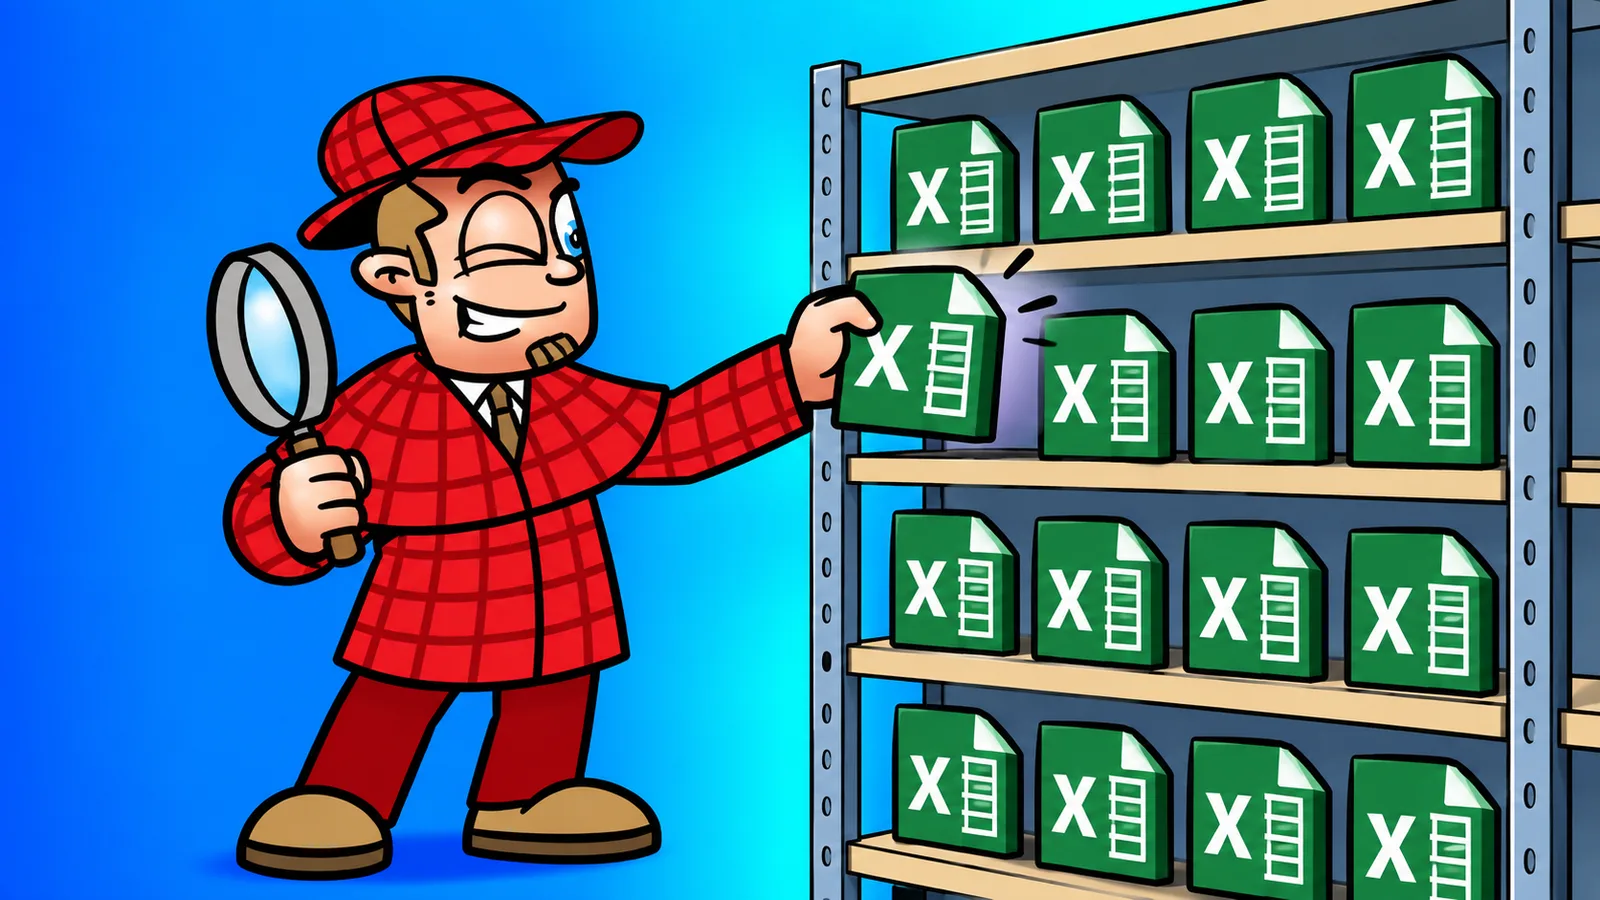
What data does freight cost software actually need?
Invoices, shipment data, or tariffs: what data does freight cost software actually need for analysis, invoice auditing, and tendering – and in which format?

Does Freight Cost Software Need an ERP or TMS Integration?

Freight Costs Rising: How to Find Out Where the Extra Costs Really Come From

Freight Cost Management Software: Analysis, Invoice Auditing and Tendering in One System

Lack of Transparency Often Means: Hidden Costs
Logistics costs are often spread across dozens of carriers, thousands of shipments, and different systems. Without a central dashboard, you're flying blind. The result: cost drivers remain hidden, optimization potential untapped.
Fragmented data prevents unified analysis.
Invoices in different formats, TMS exports without standardization, and manual Excel analysis create an incomplete picture.
ShipCheck digitizes and normalizes all data sources and calculates consistent KPIs across all transport modes and trade lanes.
Cost drivers become visible months later.
Without efficient logistics controlling, rising costs per shipment, inefficient routes, and excessive surcharges go unnoticed.
ShipCheck detects cost deviations and alerts automatically on unusual patterns.
Management reporting takes days, not minutes.
For every monthly report, data from different systems is manually collected, cleaned, and transferred into presentations.
ShipCheck generates automated reports with one click — ready for executives and controlling.