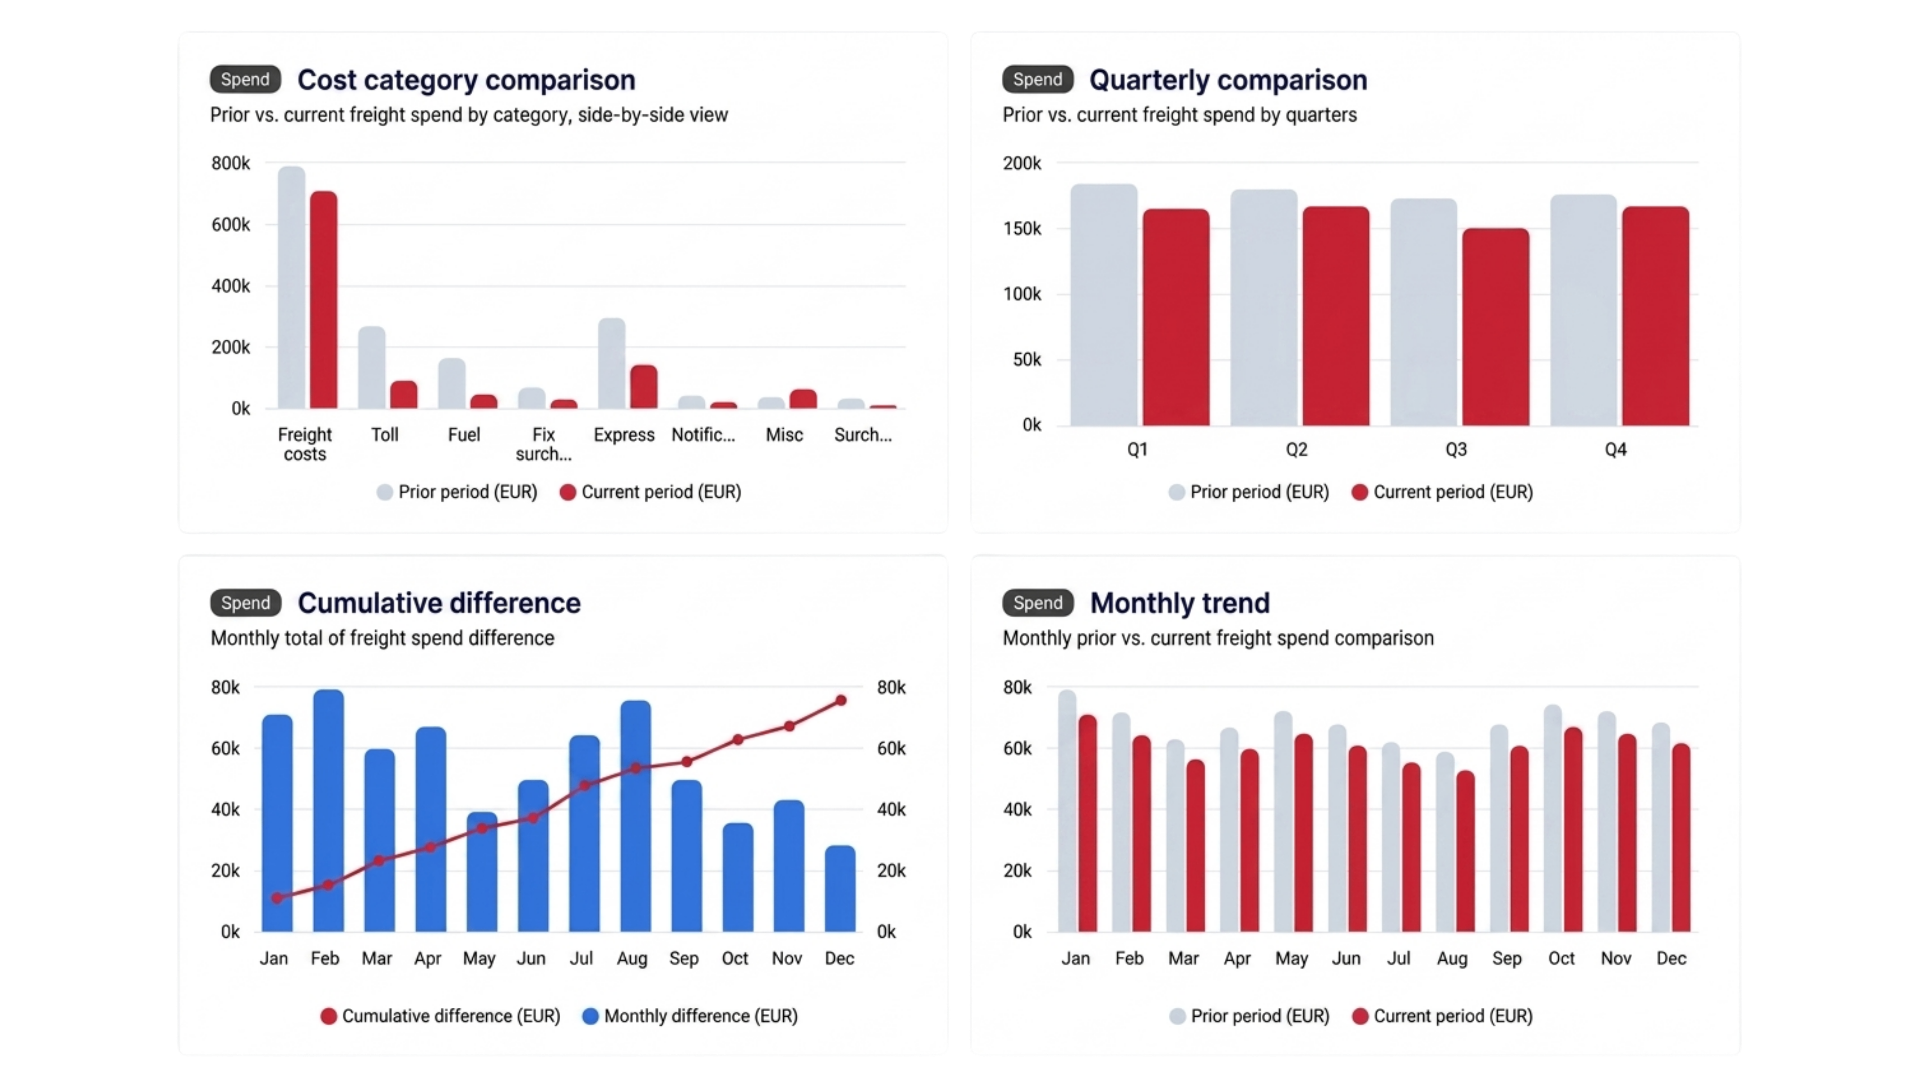
Many companies know their total freight costs very precisely. They know how much they spent last month, compare budgets with actual costs and can see whether a carrier has become more expensive year over year.
What these numbers often do not show is why the costs changed.
That is exactly why HDS fundamentally analyzes logistics costs not only in aggregate, but at the level of the individual shipment – including the respective ancillary freight costs.
An average can be a useful management signal. For the actual cost analysis, however, it is often too coarse.
What does freight cost analysis at shipment level mean?
In a shipment-level analysis, the focus is not only on what a company paid in total for a carrier, region or month. Instead, each individual shipment is assessed as completely as possible.
Typical information includes:
- weight
- lane
- service provider
- base freight
- surcharge line items
- mode of transport
- other tariff-related cost components
HDS deliberately works at this level of granularity. For a robust analysis, the most detailed possible data for each shipment is particularly valuable, including weight, lane, service provider and surcharge line items.
The difference is significant. An aggregated analysis says: “Our freight costs increased by 3%.”
A shipment-level analysis can show: “Costs increased mainly on certain lanes and because of specific surcharges, while other areas became cheaper.” Only the second statement is truly actionable.
Why aggregated freight costs can give a distorted picture
The basic problem is simple: different developments can cancel each other out in the average.
An example:
- Lane A becomes significantly cheaper.
- Lane B becomes significantly more expensive.
- Total costs remain almost unchanged.
Management reporting creates the impression: “No significant change.” In reality, two parts of the transport structure have developed in completely different directions.
HDS observes exactly this in practice. Economic conditions can affect individual freight segments very differently at the same time. While one segment becomes cheaper due to excess capacity, another can become significantly more expensive due to capacity constraints.
Anyone looking only at total costs will often see these shifts too late.
Comparing against the previous year is not enough
A historical comparison can also create a false sense of security. If a company reduces its freight costs by 2% compared with the previous year, that initially sounds positive.
But this information only answers: “How are we doing compared with ourselves?” It does not answer: “How has the market developed on our specific lanes?”
HDS describes precisely this situation as a recurring problem. Internal teams naturally know mainly their own contracts and their own history. HDS, by contrast, continuously compares against real market prices from a quotation database fed by numerous current and completed projects.
This matters because an internal cost increase may appear plausible even though market conditions on the relevant lanes have improved at the same time. Conversely, an apparently poor cost increase may be entirely understandable if a segment has become significantly more expensive economically.
The average does not show where the problem lies
Even when total costs clearly increase, another question remains unanswered without sufficient granularity: What is causing the change?
Possible causes differ considerably:
- higher base rates
- different volume structures
- changed lanes
- higher weights
- fuel surcharges
- tolls
- additional services
- different carrier mixes
- individual cost items
A blanket statement such as “freight costs +6%” is of limited help in root-cause analysis. A shipment-level view, by contrast, enables drill-down:
Total costs → mode of transport → carrier → lane → shipment → cost item
That is where it becomes visible which cost component is actually driving the development.
Ancillary freight costs are particularly easy to overlook
One particularly important area is ancillary freight costs. Based on HDS experience, many shippers accept surcharges as justified in principle but question their actual level much less frequently. HDS therefore also evaluates ancillary costs at the level of the individual shipment.
This matters because a stable base rate can easily create the impression of stable freight costs. The actual costs per shipment can nevertheless rise, for example due to:
- fuel surcharges
- tolls
- additional services
- other tariff-related ancillary costs
If these items appear only as lump sums in internal analyses, the actual cost development remains difficult to understand. HDS regularly sees exactly this in company data: ancillary freight costs are often not broken down cleanly, but shown only in aggregate.
Why data quality is often worse than expected
A shipment-level analysis requires reliable data. In practice, however, this data is often:
- distributed across multiple systems
- incomplete at individual locations
- structured differently
- aggregated too coarsely for ancillary costs
HDS therefore describes data quality in companies as highly variable and often worse than initially assumed. But that does not mean precise analysis is impossible.
Part of the work is precisely to close these information gaps and structure the data so that shipment-level assessment becomes possible. Typically, the following are required:
- freight invoices or shipment data
- existing contracts
- tariff structures
- information on locations and freight flows
- weight
- lane
- service provider
- surcharge line items
Why savings potential cannot be credibly quantified as a blanket percentage
Shipment-level analysis is also crucial when discussing savings. Blanket claims such as “We reduce your freight costs by 10%” are only of limited reliability before an analysis has been carried out.
HDS explicitly argues that the real potential depends on how far a company’s own cost structure has moved away from current market developments. Credible figures only emerge from a shipment-level comparison.
The possible sources of savings also differ depending on the situation. In one area, better market conditions may be the lever. In another, it may be ancillary freight costs. Elsewhere, there may be hardly any potential because the existing tariff is already good.
An average-based analysis cannot represent these differences cleanly.
Why service requirements must also be taken into account
Another important point in the HDS methodology: not every cheaper transport is automatically a better transport.
The analysis must also take into account the requirements placed on the logistics service and the required quality. HDS explicitly refers here to the problem of comparing “apples and oranges.”
A meaningful comparison therefore must ask not only: “Which tariff is cheaper?” It must also ask: “Are the underlying services actually comparable?” This applies, for example, to different:
- transit times
- service levels
- delivery options
- modes of transport
- regional requirements
A shipment-level analysis creates the basis for taking such differences into account properly.
Why current data matters more than yesterday’s experience
Freight markets change continuously. An approach that was right one or two years ago may already be outdated today. HDS names this explicitly as one of the guiding principles of its methodology.
Possible causes include:
- excess capacity
- capacity constraints
- fluctuating fuel costs
- geopolitical changes
- regional differences
- changes in spot and contract markets
HDS describes, for example, how ocean, air and road freight can develop differently at the same time. That is exactly why a historical average rate is not a sufficient benchmark for the current situation.
From consulting methodology to software
The underlying methodology is clear: do not start with the total budget, but with the individual transports.
ShipCheck was developed from the logistics cost expertise and working methods of the HDS International Group. The software transfers this principle into a scalable data structure. Freight invoices, TMS data and other transport information are structured and standardized.
In the KPI dashboard, costs can then be analyzed by dimensions such as:
- carrier
- mode of transport
- lane
- region
- individual shipment
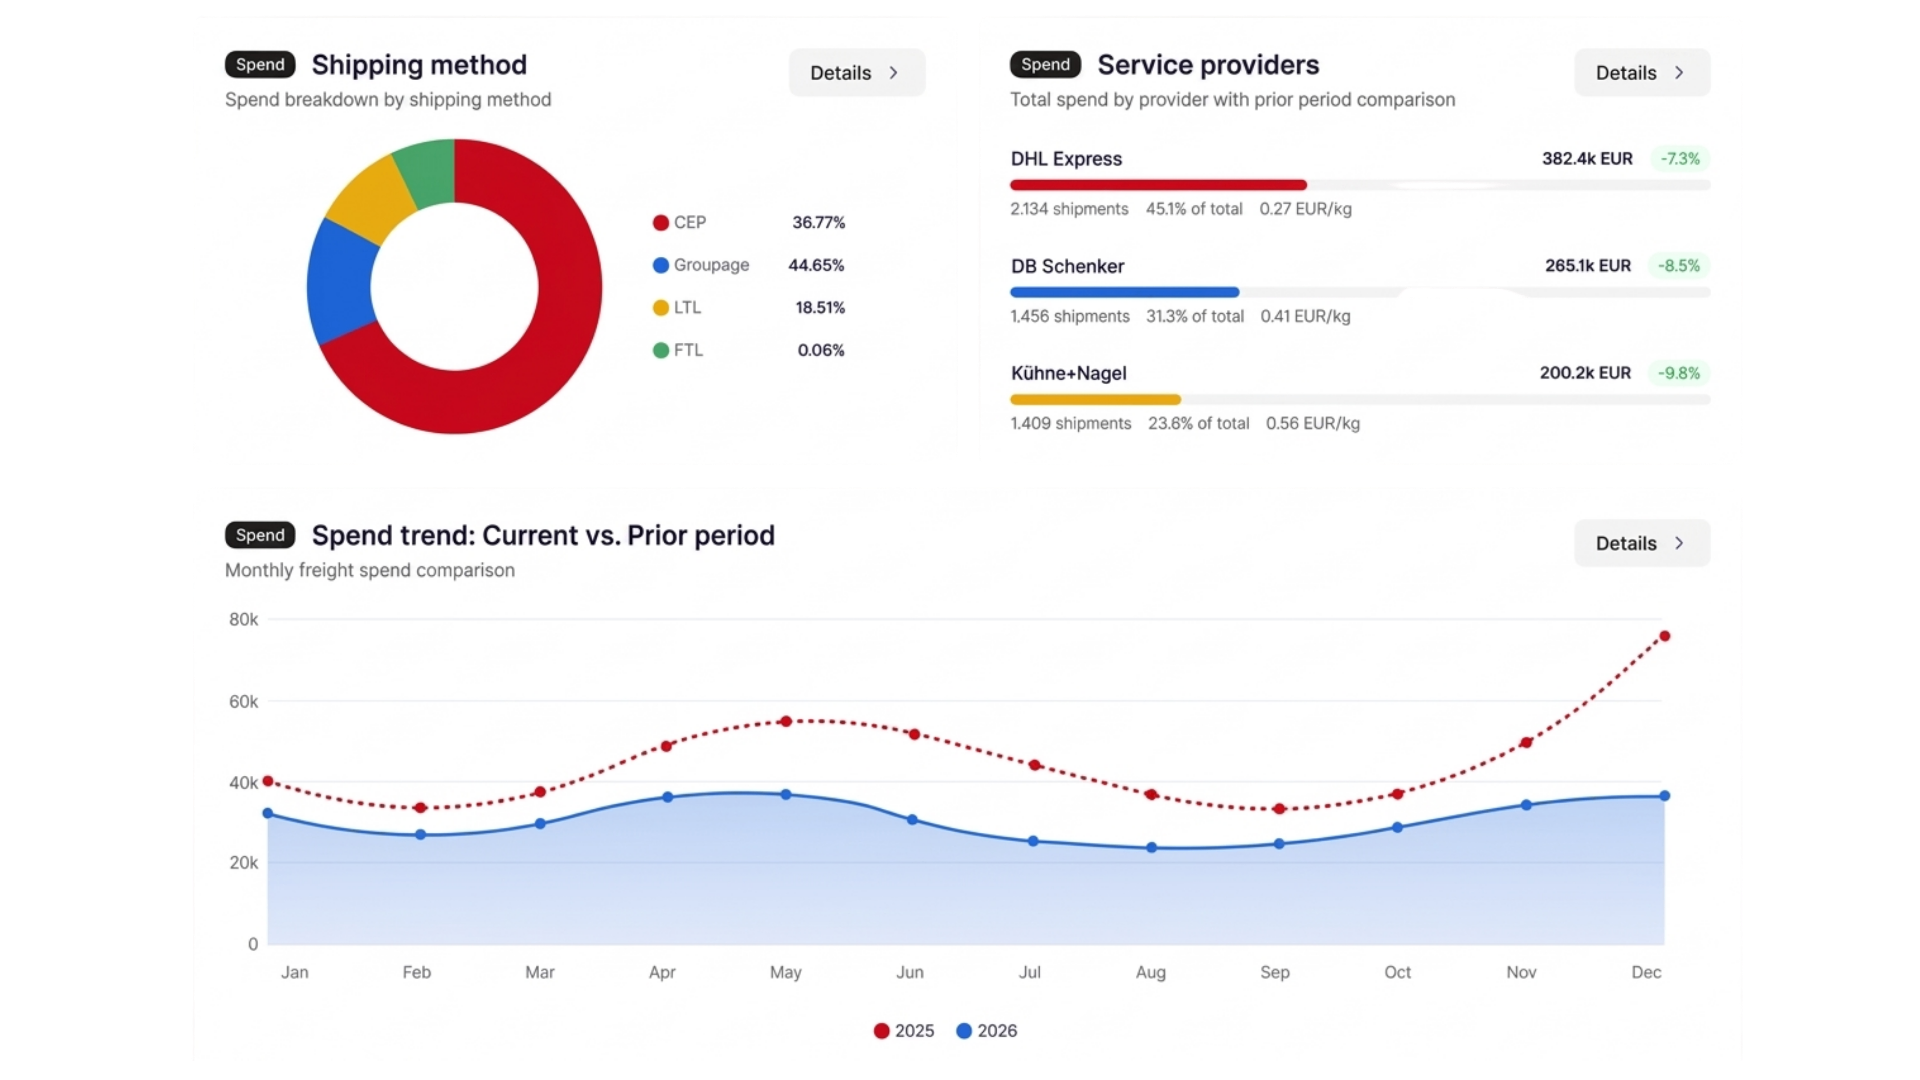
ShipCheck enables drill-down from the overall view down to the individual transport. The purpose is not to replace the HDS methodology. Software makes the same level of granularity permanently usable for large volumes of data.
What does shipment-level analysis provide in concrete terms?
A shipment-level freight cost analysis helps companies answer questions that a pure total-cost view leaves unanswered:
- Which lanes are driving our costs?
- Which carriers are actually becoming more expensive?
- Is base freight increasing, or are ancillary costs increasing?
- Which shipment types cause particularly high costs?
- Are changes caused by price or by volume?
- Where are costs developing differently from the overall trend?
- What data basis do we have for negotiations?
- Where is deeper analysis worthwhile?
This turns a monthly report into a basis for operational and strategic decisions.
Aggregated analysis and shipment-level analysis are not contradictory
The point is not that “totals are useless.” Totals are of course important for management reporting. The decisive difference is the direction of the analysis.
A good data basis allows both: shipment → lane → carrier → overall portfolio and overall portfolio → carrier → lane → individual shipment.
This means management can continue to focus on a small number of central KPIs. If a number stands out, logistics can then trace what lies behind it. That is the actual advantage of a shipment-level data basis.
Conclusion: The total shows the result – shipment-level data explains the cause
Aggregated freight costs answer an important question: How much did we pay? For robust cost management, however, that is not enough.
Anyone who wants to understand why freight costs are changing has to go deeper:
- Which lane?
- Which carrier?
- Which shipment?
- Which tariff component?
- Which surcharge?
That is exactly why HDS fundamentally evaluates logistics costs at shipment level and also takes ancillary freight costs into account.
The goal is not more data for its own sake. The goal is a simpler answer to the decisive question: Where do our freight costs actually arise – and why?
Frequently asked questions
What does freight cost analysis at shipment level mean?
Freight costs are not viewed only in aggregate by month or carrier, but assigned to individual shipments. This makes it possible to analyze costs by lane, weight, service provider and individual cost items.
Why are average freight costs not sufficient?
Averages can conceal opposing developments. One lane can become significantly cheaper while another becomes more expensive at the same time, without the overall figure changing much.
What data is required for shipment-level analysis?
Typically, freight invoices or shipment data, contracts and tariff structures are required, together with the most precise possible information on weight, lane, service provider and surcharge line items.
Why are ancillary freight costs important?
Ancillary freight costs can cause relevant cost increases even when the base rate remains stable. HDS therefore also evaluates them per shipment rather than only as an aggregated lump sum.
Can a year-over-year comparison show whether freight costs are market-competitive?
No. A year-over-year comparison only shows the development relative to a company’s own past. Determining whether current conditions reflect the current market requires additional up-to-date comparison data.
Why can different freight segments develop differently?
Capacity, fuel costs, geopolitical factors and regional market conditions do not affect all transport segments in the same way. HDS therefore regularly observes that some segments become cheaper while others become more expensive at the same time.
What is the management benefit of shipment-level analysis?
Aggregated KPIs remain available, but can be broken down to the individual shipment when something stands out. This makes it possible to understand which specific development lies behind an overall figure.
How is ShipCheck connected to the HDS methodology?
ShipCheck was developed on the basis of the logistics cost expertise of the HDS International Group and transfers the shipment-level analysis approach into a software environment in which transport data can be structured, consolidated and analyzed down to the individual shipment.